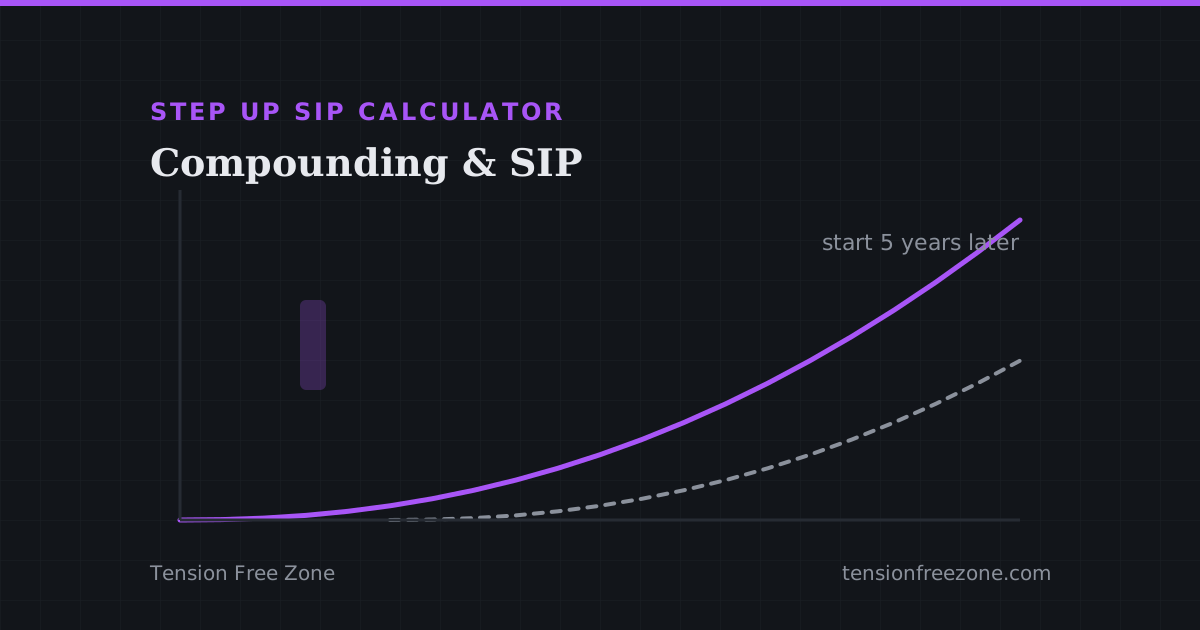
The 30 Rule: Why Waiting Five Years to Start Investing Costs a Small Fortune
What a five year delay costs a monthly SIP, how an annual step-up bends the curve, and how to read a year by year projection rather than one figure.
Watch a monthly SIP grow with compound interest, add an annual step-up, or reverse-plan the monthly amount and the time needed to reach a target corpus.
What a five year delay costs a monthly SIP, how an annual step-up bends the curve, and how to read a year by year projection rather than one figure.
You earn interest on your original money and on the interest already added, so growth accelerates over time. The projection shows this year by year and splits what you contributed from what interest produced.
You can compound yearly, quarterly, monthly, or daily. Your annual rate is divided by the number of periods per year, so more frequent compounding ends slightly higher at the same rate; the frequency also sets how often each contribution is added.
Enter a realistic long-run annual return for where the money would actually sit, such as a savings rate or an index fund average. It is used as a fixed assumption for every year, so the chart is a plan, not a promise; real markets swing year to year.
Growth is exponential, so your money doubles on a fixed cadence. The insight card shows the exact number of years for your starting amount to double at your rate and frequency (roughly 72 divided by the rate), and a longer horizon lets every contribution pass through more of those cycles.